How to Profile TPU Programs
Part 9 of How To Scale Your Model (Part 8: Serving LLaMA | Part 10: JAX)
So far this series has been entirely theoretical: back-of-the-envelope calculations based on hardware rooflines. That understanding gets you far but a lot of optimization comes down to practical details: how the XLA compiler works and how to use profiling tools like the JAX/Tensorboard Profiler to figure out what to do when it fails. We discuss this here.
A Thousand-Foot View of the TPU Software Stack
Google exposes a bunch of APIs for programming TPUs, from high level JAX code to low level Pallas or HLO. Most programmers write JAX code exclusively, which lets you write abstract NumPy-style linear algebra programs that are compiled automatically to run efficiently on TPUs.
Here’s a simple example, a JAX program that multiplies two matrices together:
import jax
import jax.numpy as jnp

def multiply(x, y):
  return jnp.einsum('bf,fd->db', x, y)

y = jax.jit(multiply)(jnp.ones((128, 256)), jnp.ones((256, 16), dtype=jnp.bfloat16))
By calling jax.jit, we tell JAX to trace this function and emit a lower-level IR called StableHLO, a platform-agnostic IR for ML computation, which is in turn lowered to HLO by the XLA compiler. The compiler runs many passes to determine fusions, layouts, and other factors that result in the HLO that is observable in a JAX profile. This HLO represents all the core linear algebra operations in the JAX code (matmuls, pointwise ops, convolutions, etc) in an LLVM-style graph view. For instance, here is an abridged version of the above program as HLO
ENTRY %main.5 (Arg_0.1: f32[128,256], Arg_1.2: bf16[256,16]) -> f32[16,128] {
  %Arg_1.2 = bf16[256,16]{1,0} parameter(1), metadata={op_name="y"}
  %convert.3 = f32[256,16]{1,0} convert(bf16[256,16]{1,0} %Arg_1.2),
  %Arg_0.1 = f32[128,256]{1,0} parameter(0), metadata={op_name="x"}
  ROOT %dot.4 = f32[16,128]{1,0} dot(f32[256,16]{1,0} %convert.3, f32[128,256]{1,0} %Arg_0.1), lhs_contracting_dims={0}, rhs_contracting_dims={1},
}
We’ll explain the syntax of HLO in just a second, but for now just note that it actually matches the JAX code above fairly well. For instance,
ROOT %dot.4 = f32[16,128]{1,0} dot(f32[256,16]{1,0} %convert.3, f32[128,256]{1,0} %Arg_0.1), lhs_contracting_dims={0}, rhs_contracting_dims={1}
is the actual matmul above that multiplies two f32 matrices along the 0 and 1 dimensions, respectively.
To transform this HLO to code that can be executed on the TPU, the XLA compiler first lowers it to LLO (low-level optimizer) IR. LLO programs the TPU directly, scheduling copies between memories, pushing arrays onto the systolic array, etc. LLO code contains primitives that push buffers into the systolic array, pull results off, and schedule DMAs that communicate between different pieces of TPU memory. Once this has been lowered to LLO, it is then compiled to machine code that is loaded into the TPU IMEM and executed.
When a program is running slower than we’d like, we primarily work with the JAX level to improve performance. Doing so, however, often requires us to understand some of the semantics of HLO and how the code is actually running on the TPU. When something goes wrong at a lower level, we pull yet another escape hatch and write custom kernels in Pallas. To view the HLO of a program and its runtime statistics, we use the JAX profiler.
The JAX Profiler: A Multi-Purpose TPU Profiler
JAX provides a multi-purpose TPU profiler with a bunch of useful tools for understanding what’s happening on the TPU when a program is run. You can use the jax.profiler module to trace a program as it’s running and record everything from the duration of each subcomponent, the HLO of each program, memory usage, and more. For example, this code will dump a trace to a file in /tmp/tensorboard that can be viewed in TensorBoard (here is a step-by-step guide).
import jax
with jax.profiler.trace("/tmp/tensorboard"):
  key = jax.random.key(0)
  x = jax.random.normal(key, (1024, 1024))
  y = x @ x
  y.block_until_ready()

# Now you can load TensorBoard in a Google Colab with
#
# !pip install tensorboard tensorboard-plugin-profile
# %load_ext tensorboard
# %tensorboard --logdir=/tmp/tensorboard
#
# or externally with
#
# > tensorboard --logdir=/tmp/tensorboard
#
Here’s an overview of what you can do in the profiler:
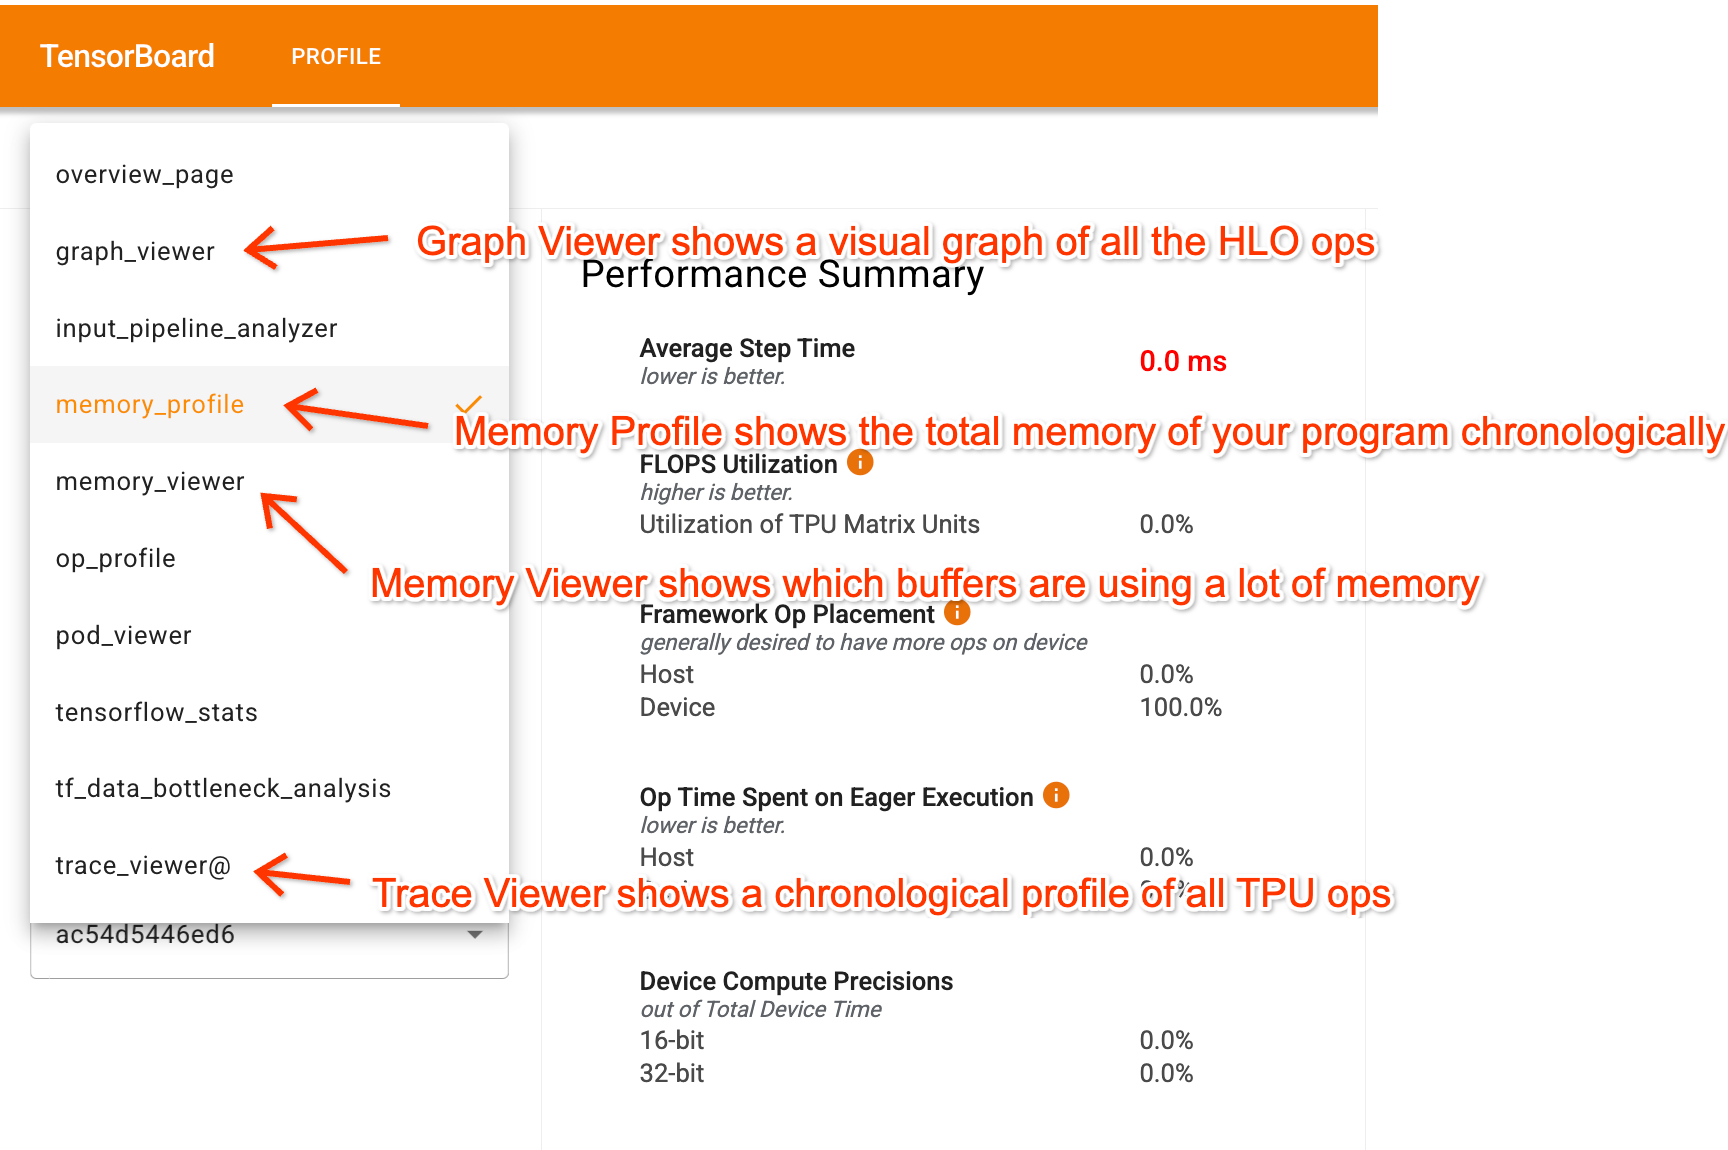
Once in TensorBoard, the profiler has a few key tabs that help you understand your program:
- Trace Viewer shows a detailed timeline of what’s actually happening on the TPU.
- Graph Viewer shows the HLO graph, letting you see what parts of the program feed into each other and how things are sharded.
- Memory Profile and Memory Viewer: these show how much memory your program is using.
While it’s slightly difficult to share profiles, here is a Perfetto link that contains at least the Trace Viewer component for a simple Transformer. This Colab lets you generate the full JAX/TensorBoard trace and play around with it.
Trace Viewer
The Trace Viewer is probably the most useful part of the profiler. The example below shows a simple Transformer with pieces annotated. Names come from labels provided in the code.
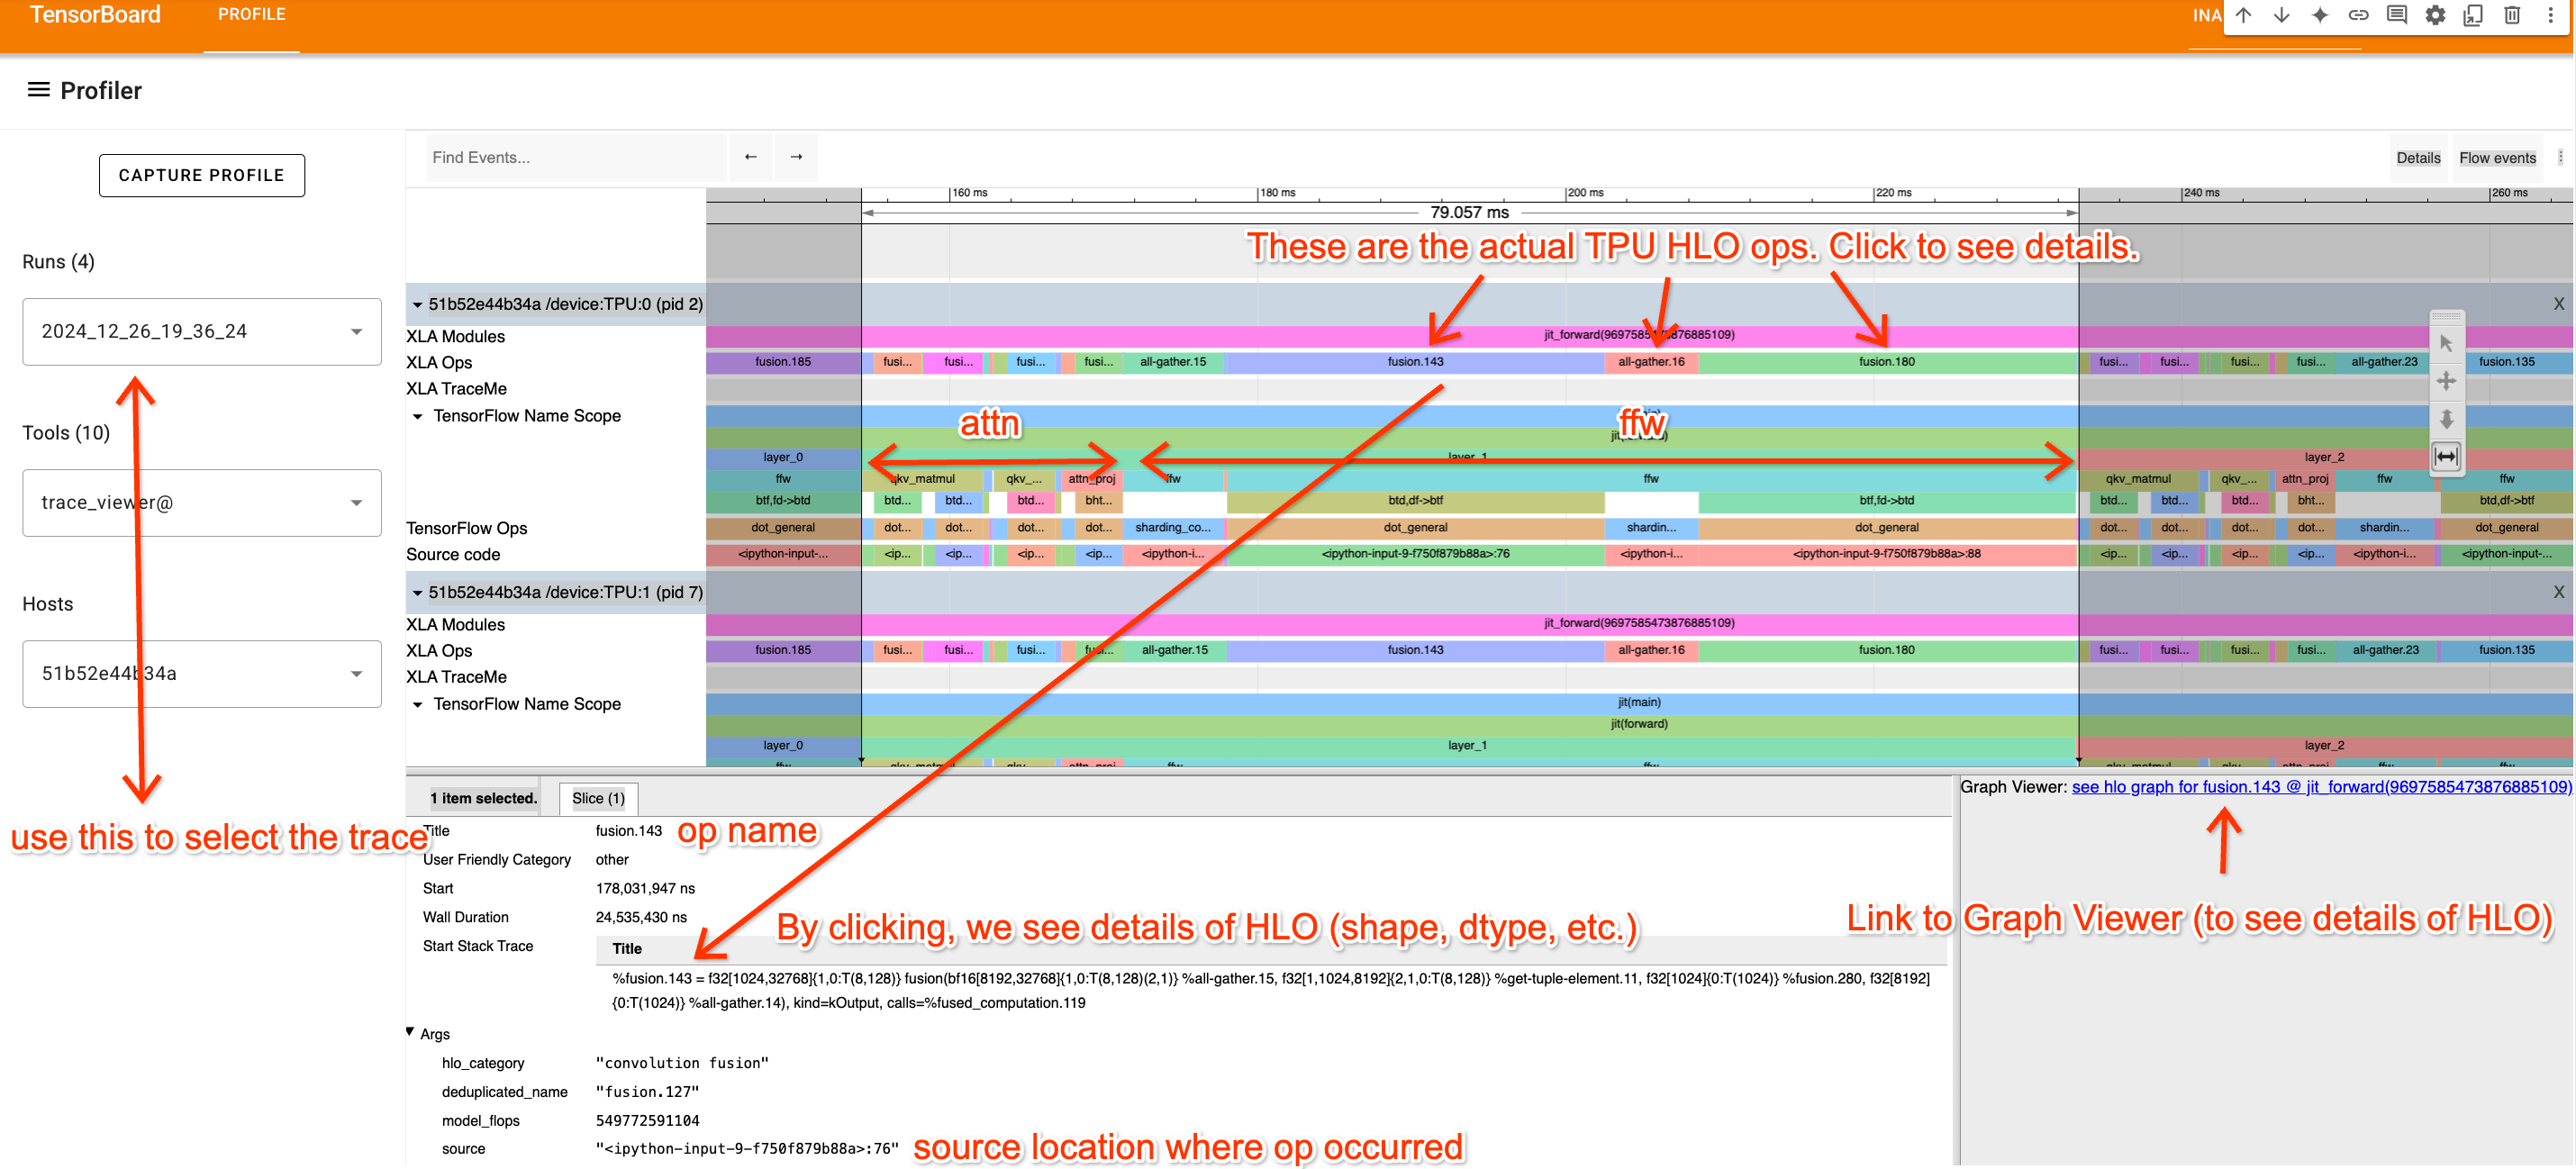
The Trace Viewer shows a chronological timeline of all the actions on each TPU core. We’re only looking at TPU:0 here, since typically all TPUs execute the same instructions. A few key notes:
- The top row (XLA Ops) shows the actual TPU operations (the names are HLO names). Everything else is an approximate trace based on
jax.named_scope,jax.named_call, and the Python stack trace. - Noting the repeated blocks, we can isolate a single layer here. We can also see (from looking at the code/understanding how a Transformer works) what parts are attention and what parts are MLPs.
- By clicking on an XLA op, we can view where in the code it comes from (useful for understanding the trace) and see links to the Graph viewer.
Tip: you can navigate the Trace Viewer using “video game” style controls, with A/D panning left and right, and W/S zooming in and out. These controls make navigating a lot easier.
How to read an XLA op
HLO isn’t actually very hard to read, and it’s very helpful for understanding what a given part of the trace above corresponds to. Here’s an example op called fusion.3.
%fusion.3 = bf16[32,32,4096]{2,1,0:T(8,128)(2,1)S(1)} fusion(bf16[32,32,8192]{2,1,0:T(8,128)(2,1)S(1)} %fusion.32), kind=kCustom, calls=%all-reduce-scatter.3
Let’s break this down into its pieces.
- Op Name: fusion.3
- A dot or fusion op is a set of operations containing at most 1 matrix multiplication and possibly a bunch of related pointwise VPU-ops.
- Shape/layout:
bf16[32,32,4096]- This is the output shape of the op. We can see the dtype is bf16 (2 bytes per parameter) and
[32,32,4096]is the shape.
- This is the output shape of the op. We can see the dtype is bf16 (2 bytes per parameter) and
- Layout:
{2,1,0:T(8,128)(2,1)}-
{2,1,0:T(8,128)(2,1)}tells us the order of the axes in memory (column major, row major, etc.) and the array padding. More below.
-
- Memory location: S(1)
- S(1) tells us this array lives in VMEM. S(0) (sometimes omitted) is HBM. S(2) and S(3) are other memory spaces.
- Arguments:
bf16[32,32,8192]{2,1,0:T(8,128)(2,1)S(1)} %fusion.32- This op has one input, a bf16 array called fusion.32 with a particular shape. This tells us what function feeds into this one.
Let’s try to understand this notation a little more. Let’s take this as a simple example:
f32[3,5]{1,0:T(2,2)}
which again tells us that this Op returns a float32 array of shape [3, 5] with a particular tiling {1,0:T(2,2)}. While tilings don’t matter too much, briefly, tilings tell us how an N-dimensional array is laid out sequentially in memory. Here’s a diagram showing how this array is laid out:
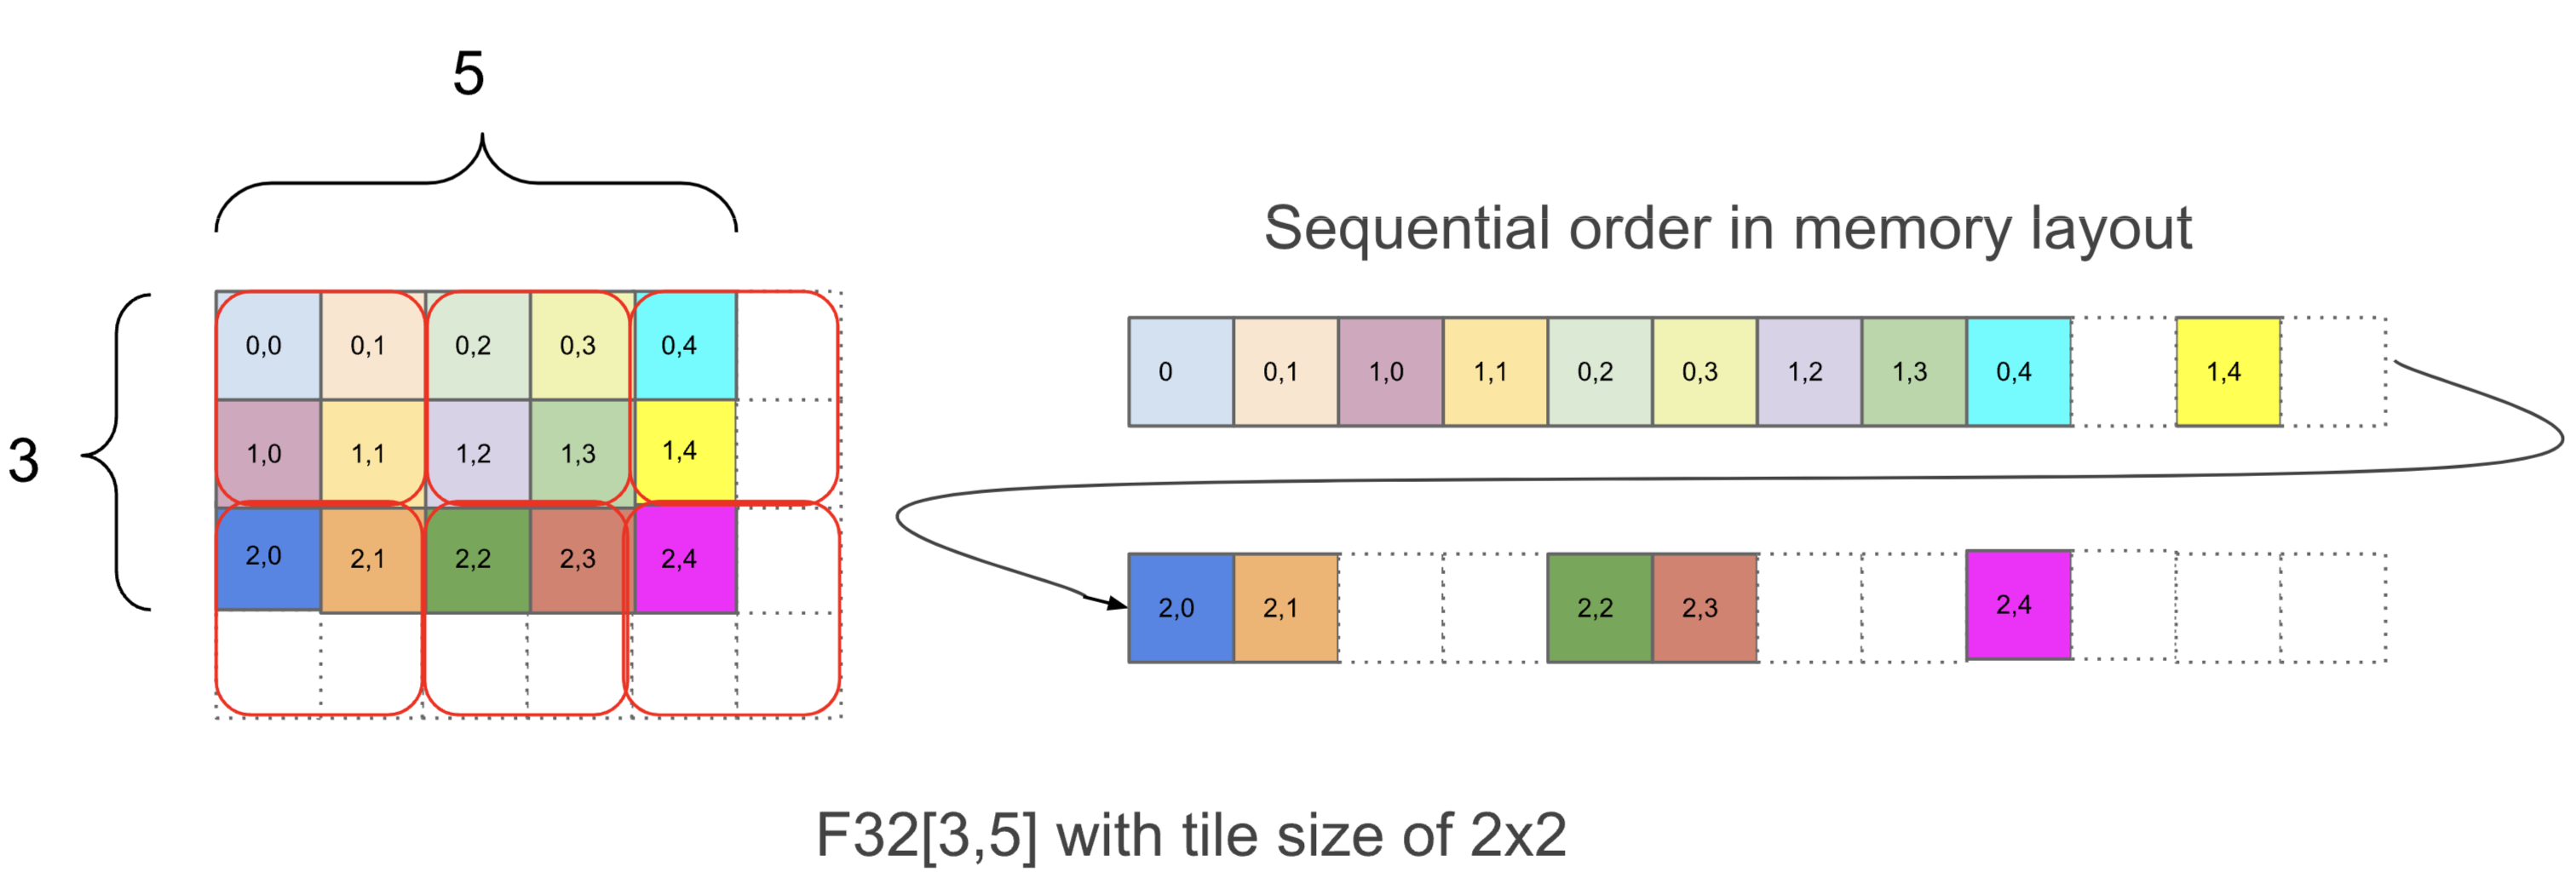
Within {1,0:T(2,2)}, the 1,0 part tells us the ordering of array dimensions in physical memory, from most minor to most major. You can read this part from right to left and pick out the corresponding dimensions in f32[3,5] to figure out the physical layout of the array. In this example, the physical layout is [3,5], identical to the logical shape. After that, T(2,2) tells us that the array is tiled in chunks of (2, 2) where within each chunk, the array has rows first (row-major), then columns, i.e. (0, 0) is followed by (0, 1), then (1, 0) and (1,1). Because of the T(2, 2) tiling, the array is padded to [4, 6], expanding its memory usage by about 1.6x. For the big bf16 array given above, bf16[32,32,8192]{2,1,0:T(8,128)(2,1)S(1)}, we do T(8,128)(2,1) which tells us the array has two levels of tiling, an outer (8, 128) tiling and an inner (2, 1) tiling within that unit (used for bf16 so our loads are always multiples of 4 bytes). For example, here’s bf16[4,8]{1,0:T(2,4)(2,1)} (colors are (2,4) tiles, red boxes are (2,1) tiles):
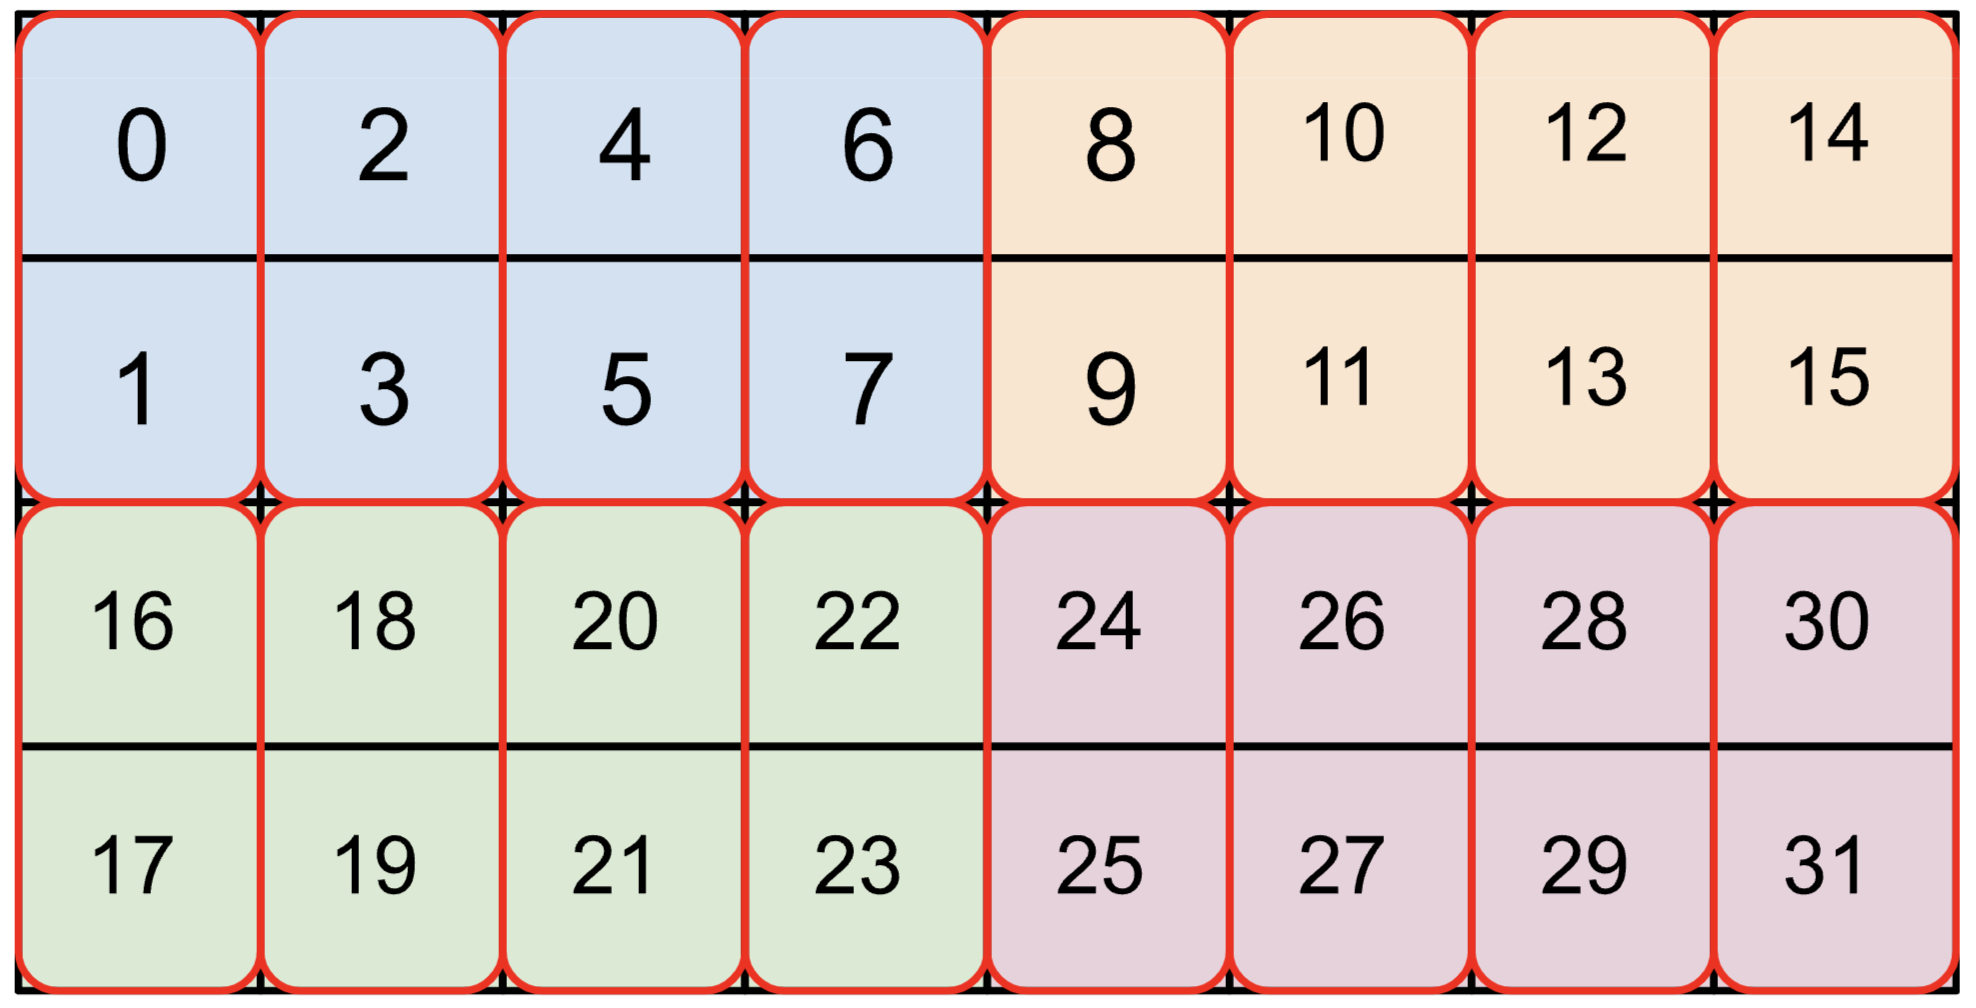
Tiling can affect how efficiently chunks of tensors can be loaded into VMEM and XLA will sometimes introduce copies that “retile” or “re-layout” a tensor inside a program, sometimes at non-trivial overhead.
Graph Viewer
While some of the fusions above can seem complicated, the XLA Graph Viewer makes them easier to parse. For example here’s the view of a fairly complicated fusion:
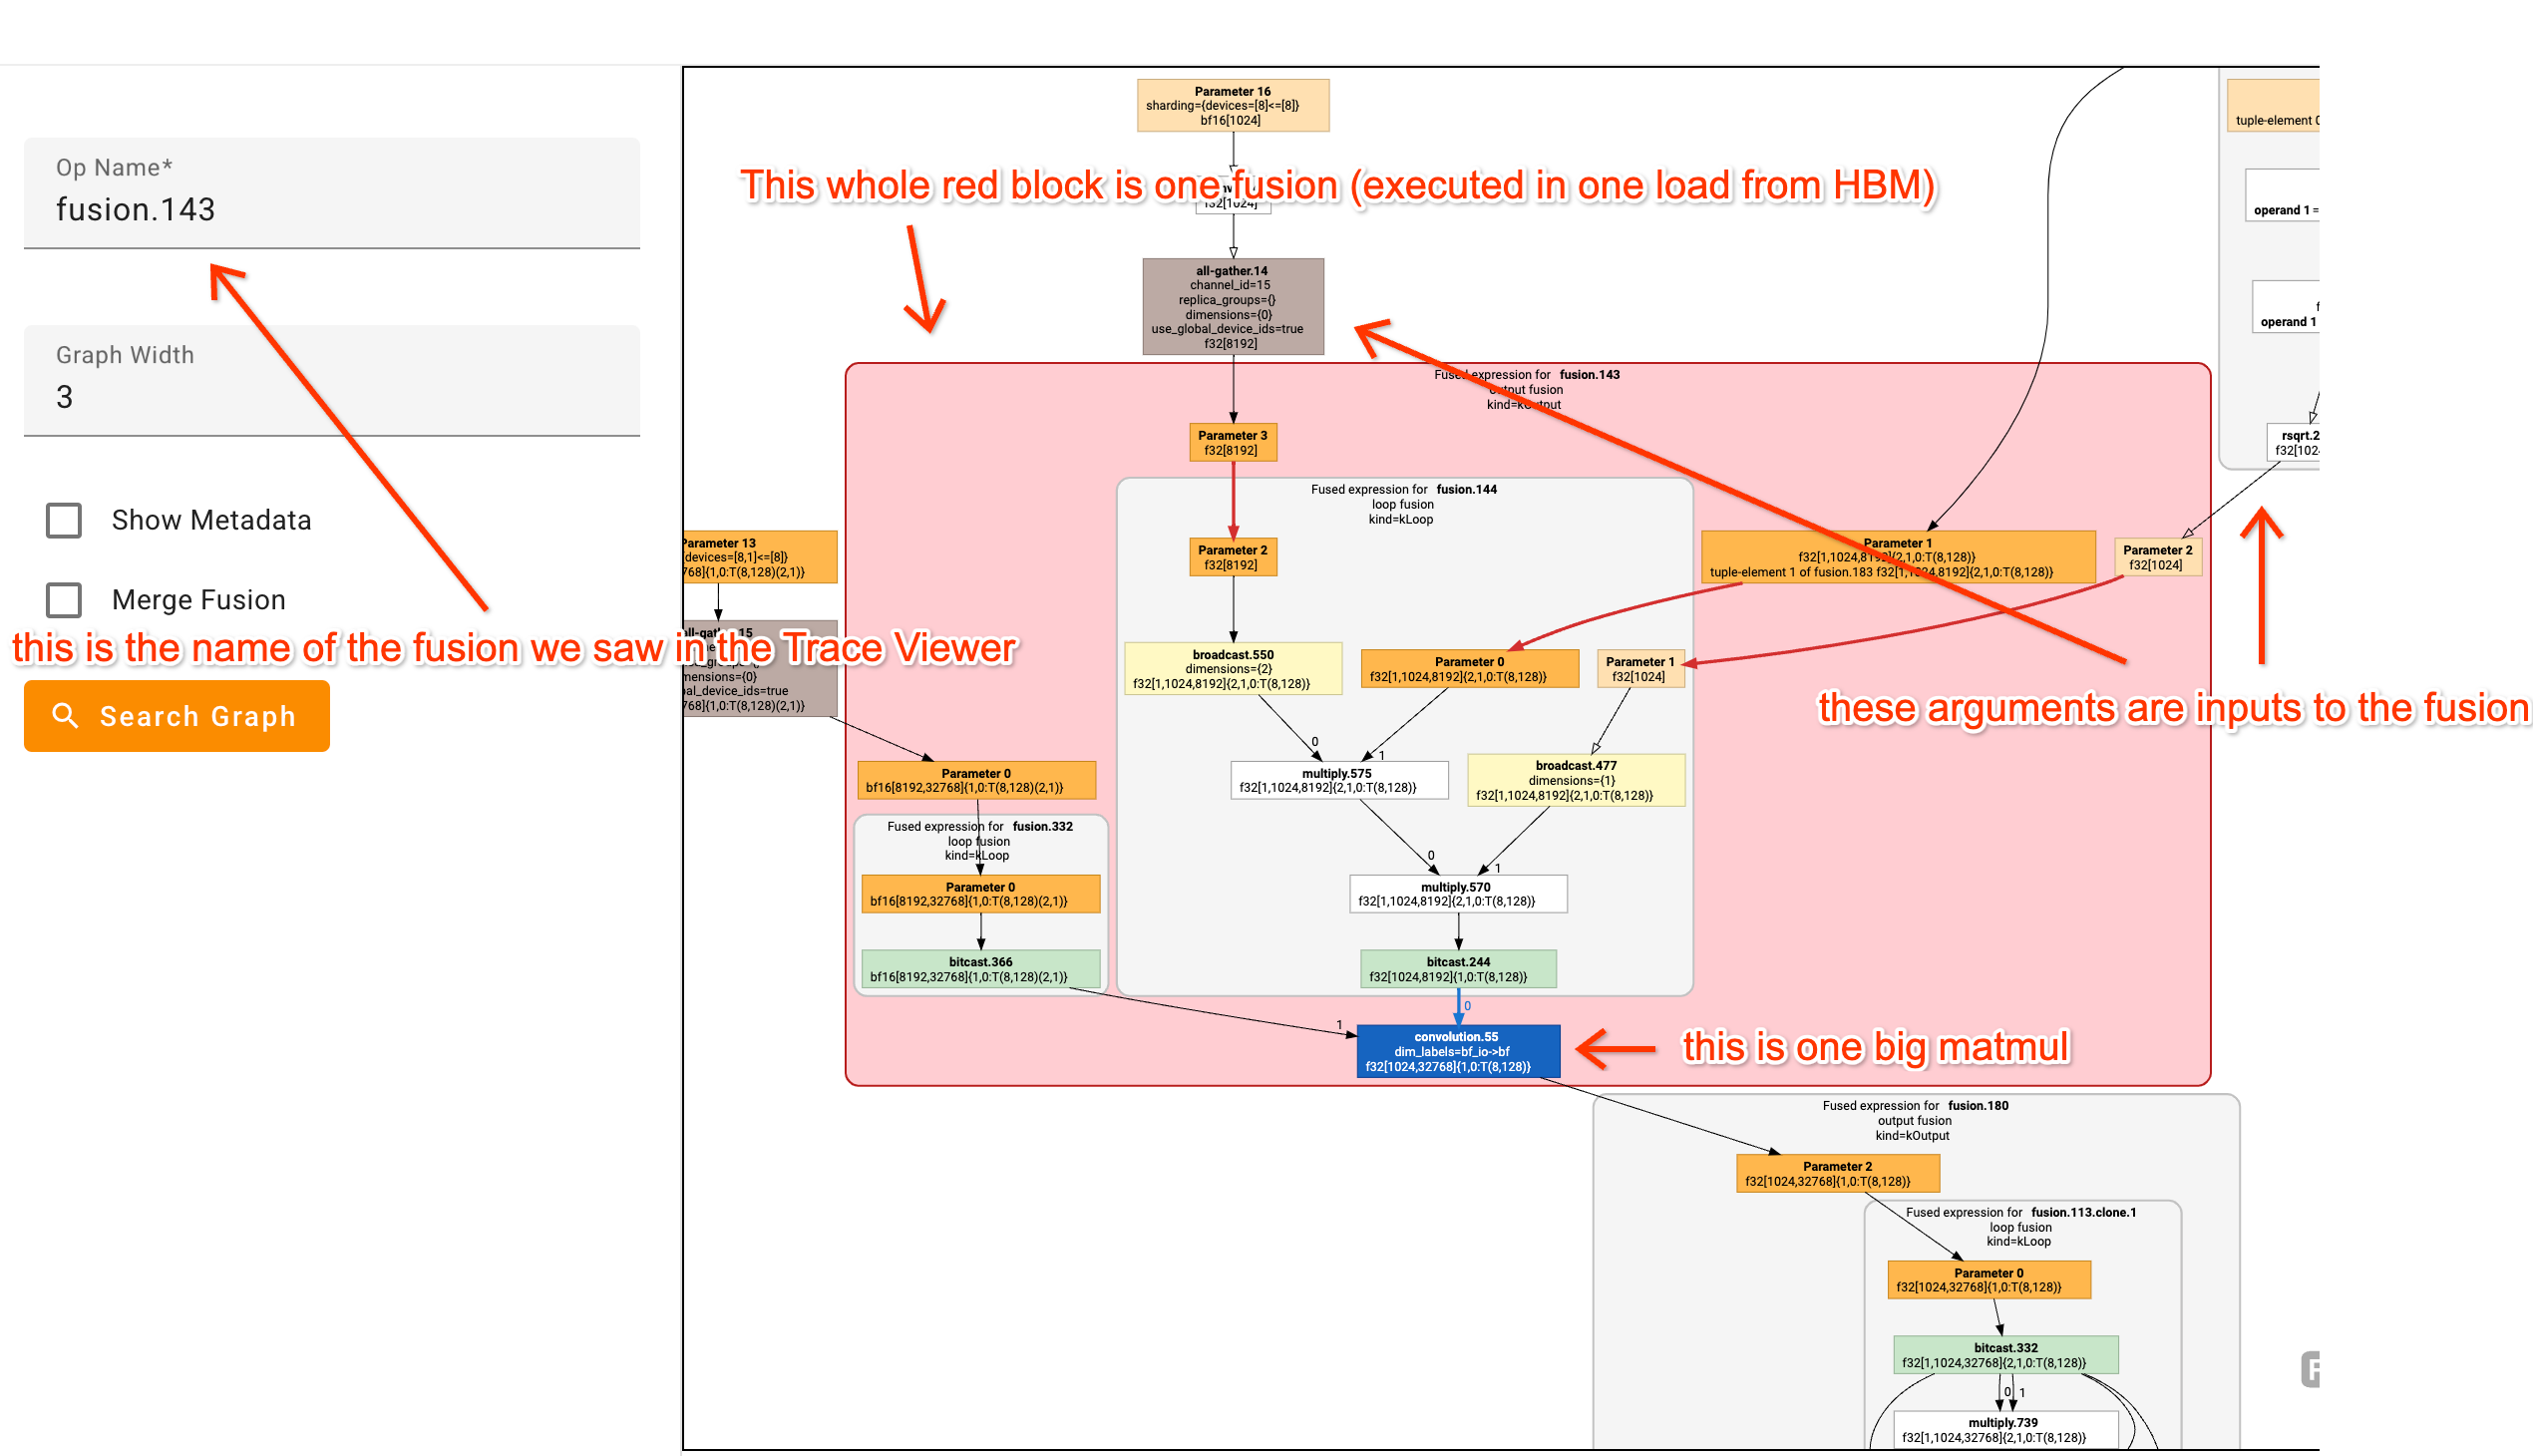
It’s really helpful to stare at a bunch of HLO graphs and try to map HLO ops onto the code you’re profiling. By hovering over a box you’ll often see the line of code where the function was defined.
Looking at a real(ish) example profile
This Colab has an example profile for a fake Transformer. Here’s a Perfetto link to at least see the Trace Viewer if you’re in a hurry. I’ve gone to more effort than usual to annotate the trace with jax.named_scope calls so you can identify what’s going on.
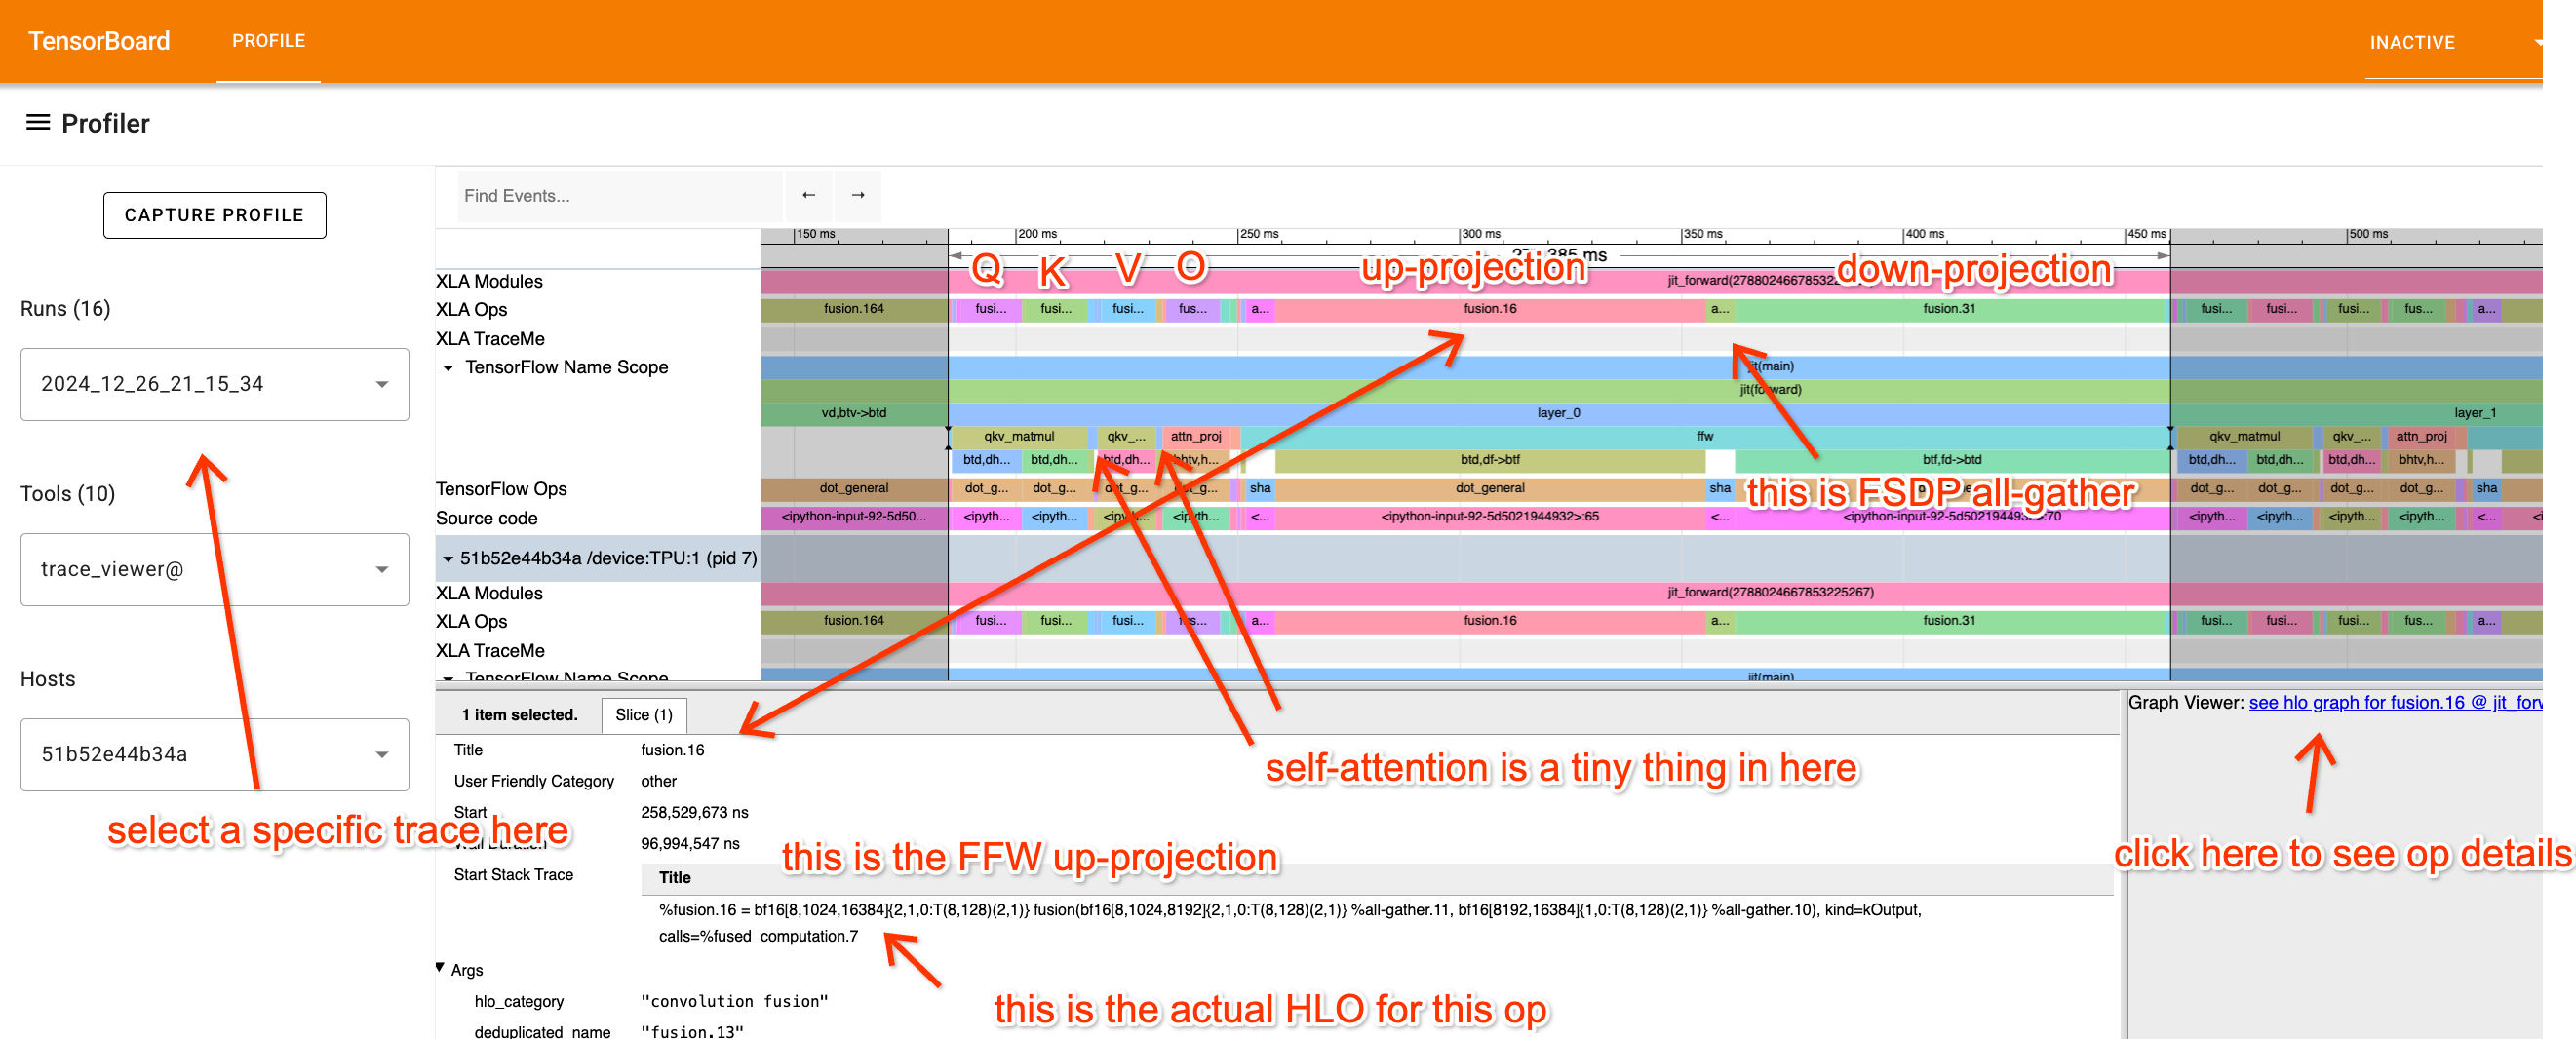
Take a look at the profile and try to really understand what each part is doing. Let’s break it down a bit, starting with the FFW block:
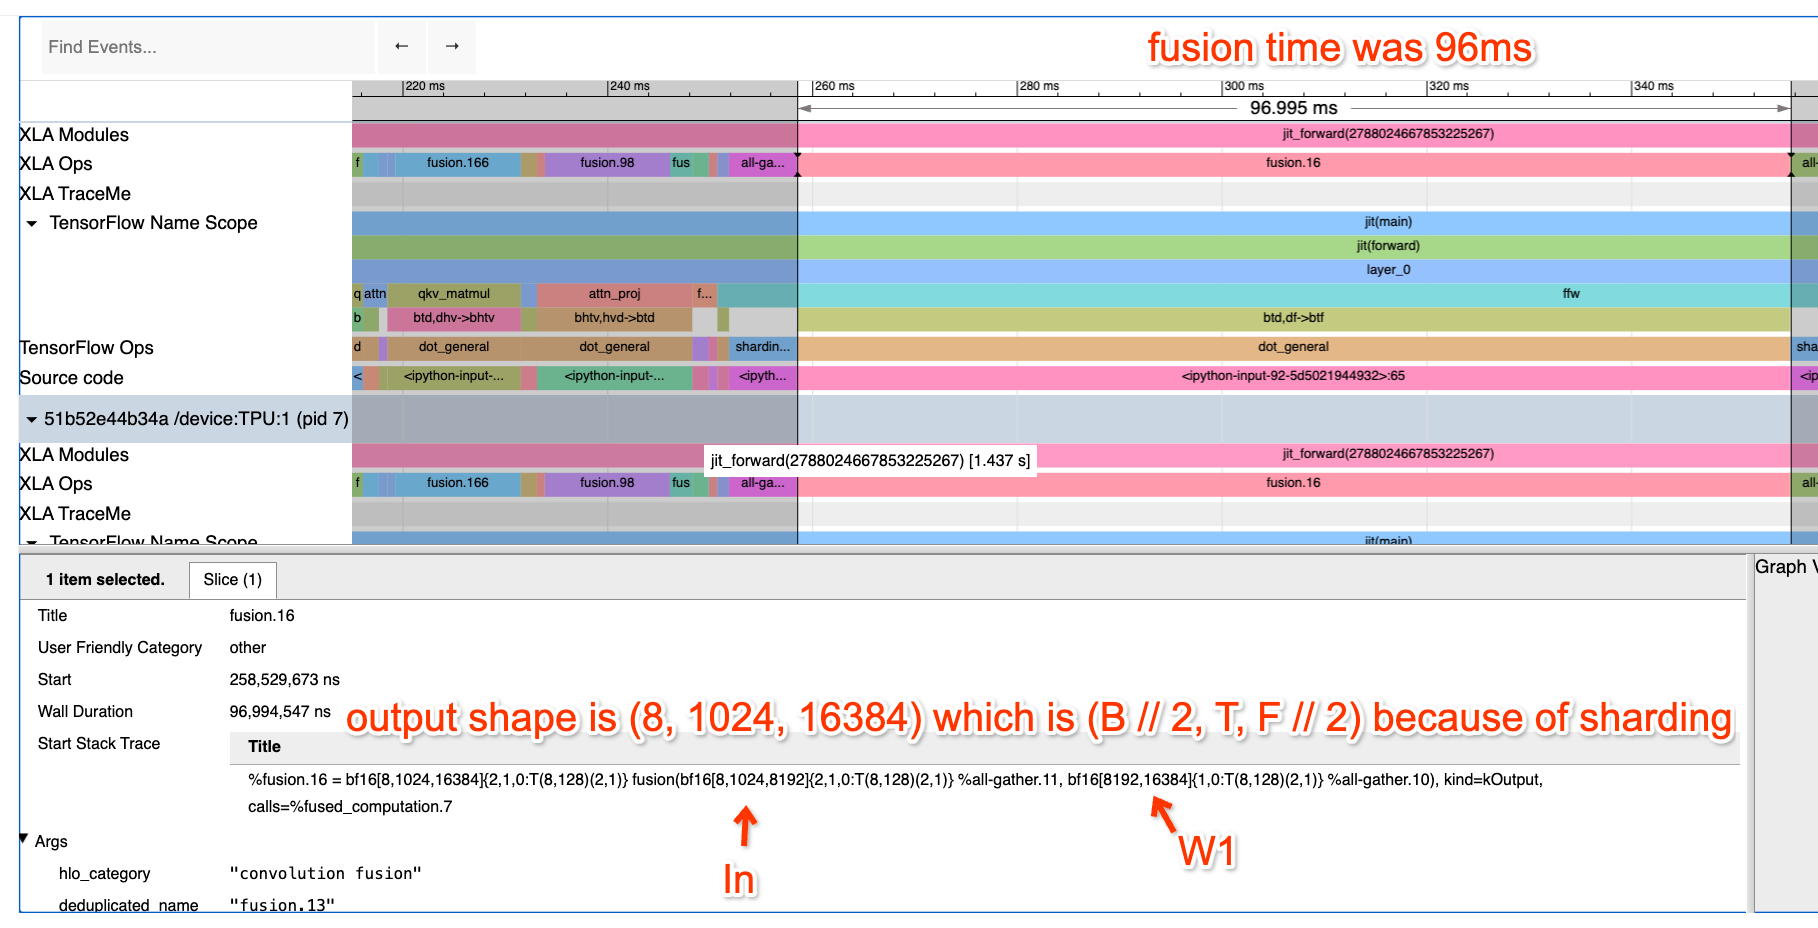
Here we’ve zoomed into the FFW block. You’ll see the up-projection Op is a fusion (matmul) with inputs bf16[8, 1024, 8192] and bf16[8192, 16384] and output bf16[8, 1024, 16384]. I know (because I wrote this code) that this is a local view of a 4-way DP, 2-way MP sharded matmul, so we’re actually doing
X: bf16[32, 1024, 8192] * Win: bf16[8192, 32768] -> Tmp: bf16[32, 1024, 32768]
How long do we expect this to take? First of all, our batch size per data parallel shard is 8 * 1024 = 8192, so we should be solidly compute-bound. This is on 8 TPUv2 cores (freely available on Google Colab), so we expect it to take about 2 * 32 * 1024 * 8192 * 32768 / (23e12 * 8) = 95.6ms which is pretty much exactly how long it takes (96ms). That’s great! That means we’re getting fantastic FLOPs utilization!
What about communication? You’ll notice the little fusion hidden at the end of the second matmul. If we click on it, you’ll see
%fusion.1 = bf16[8,1024,4096]{2,1,0:T(8,128)(2,1)} fusion(bf16[8,1024,8192]{2,1,0:T(8,128)(2,1)} %fusion.31), kind=kCustom, calls=%all-reduce-scatter.1
which is basically a little ReduceScatter (here’s the Graph Viewer);
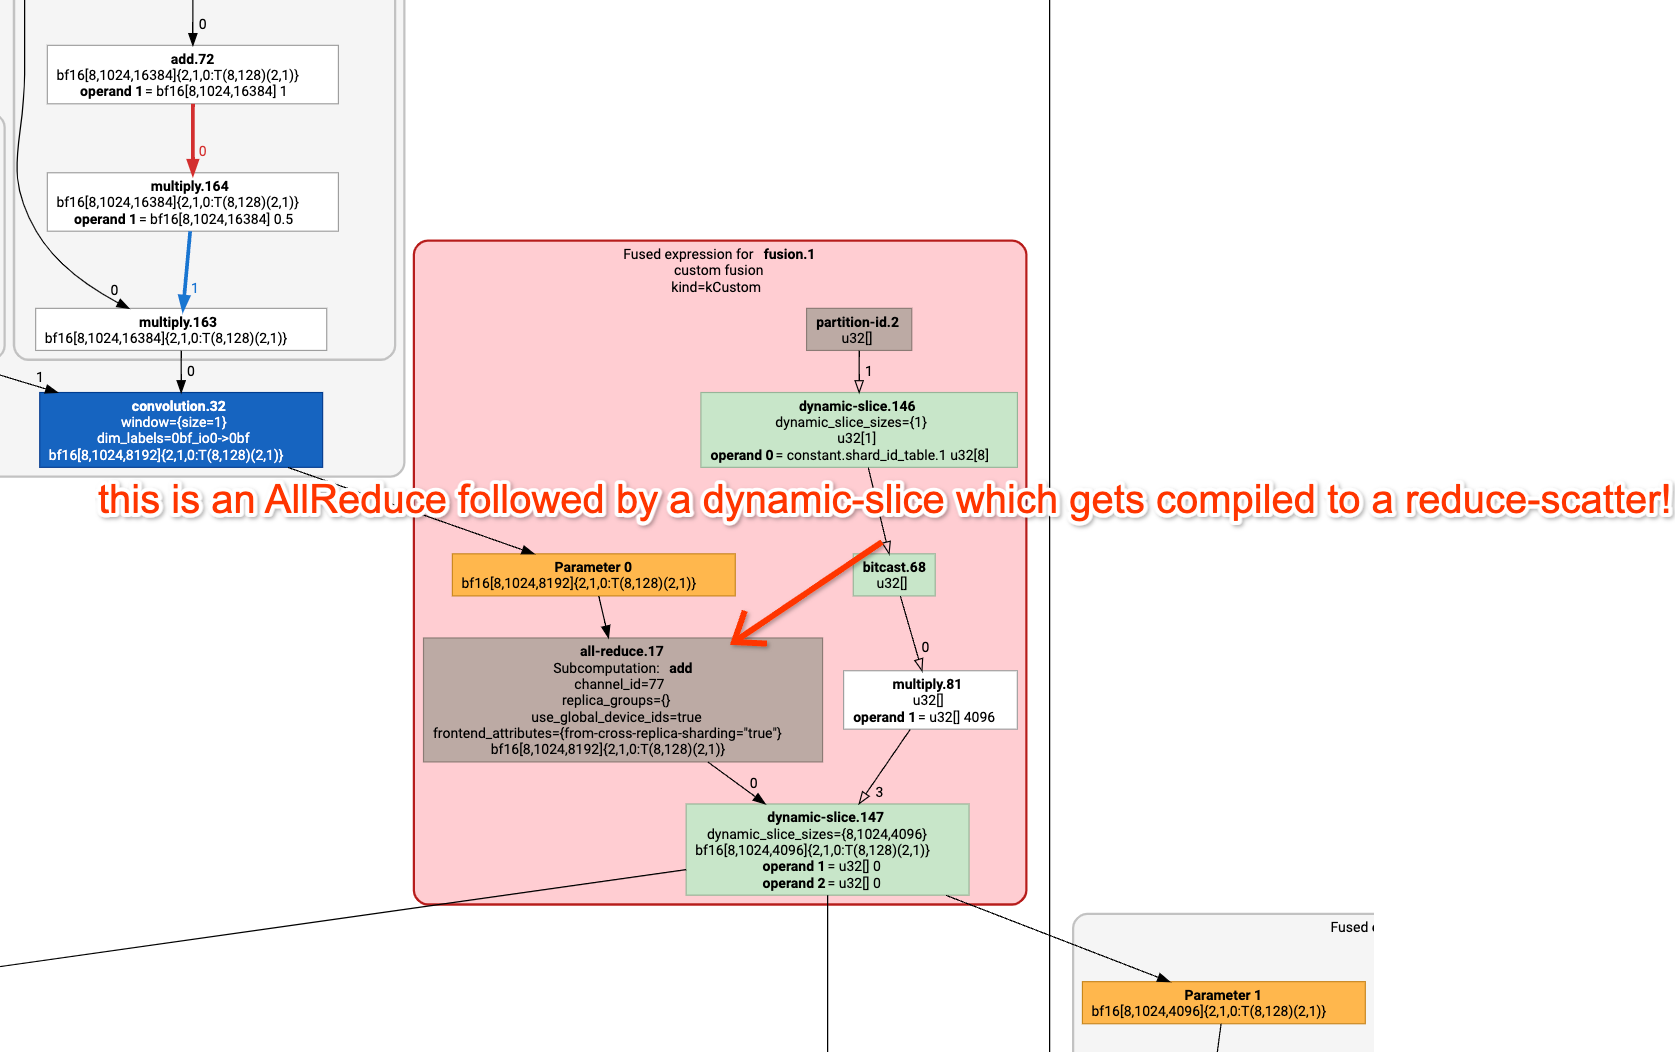
How long do we expect this to take? Well, we’re doing a ReduceScatter on a TPUv2 4x2, which should require only one hop on 1.2e11 bidirectional bandwidth. The array has size 2*32*1024*8192 with the batch axis sharded 4 ways, so each shard is 2*8*1024*8192=128MB. So this should take roughly 1.1ms. How long does it actually take? 1.13ms reported in the profile. So we’re really close to the roofline!
Let’s look at attention too! Here’s a profile of the attention component:
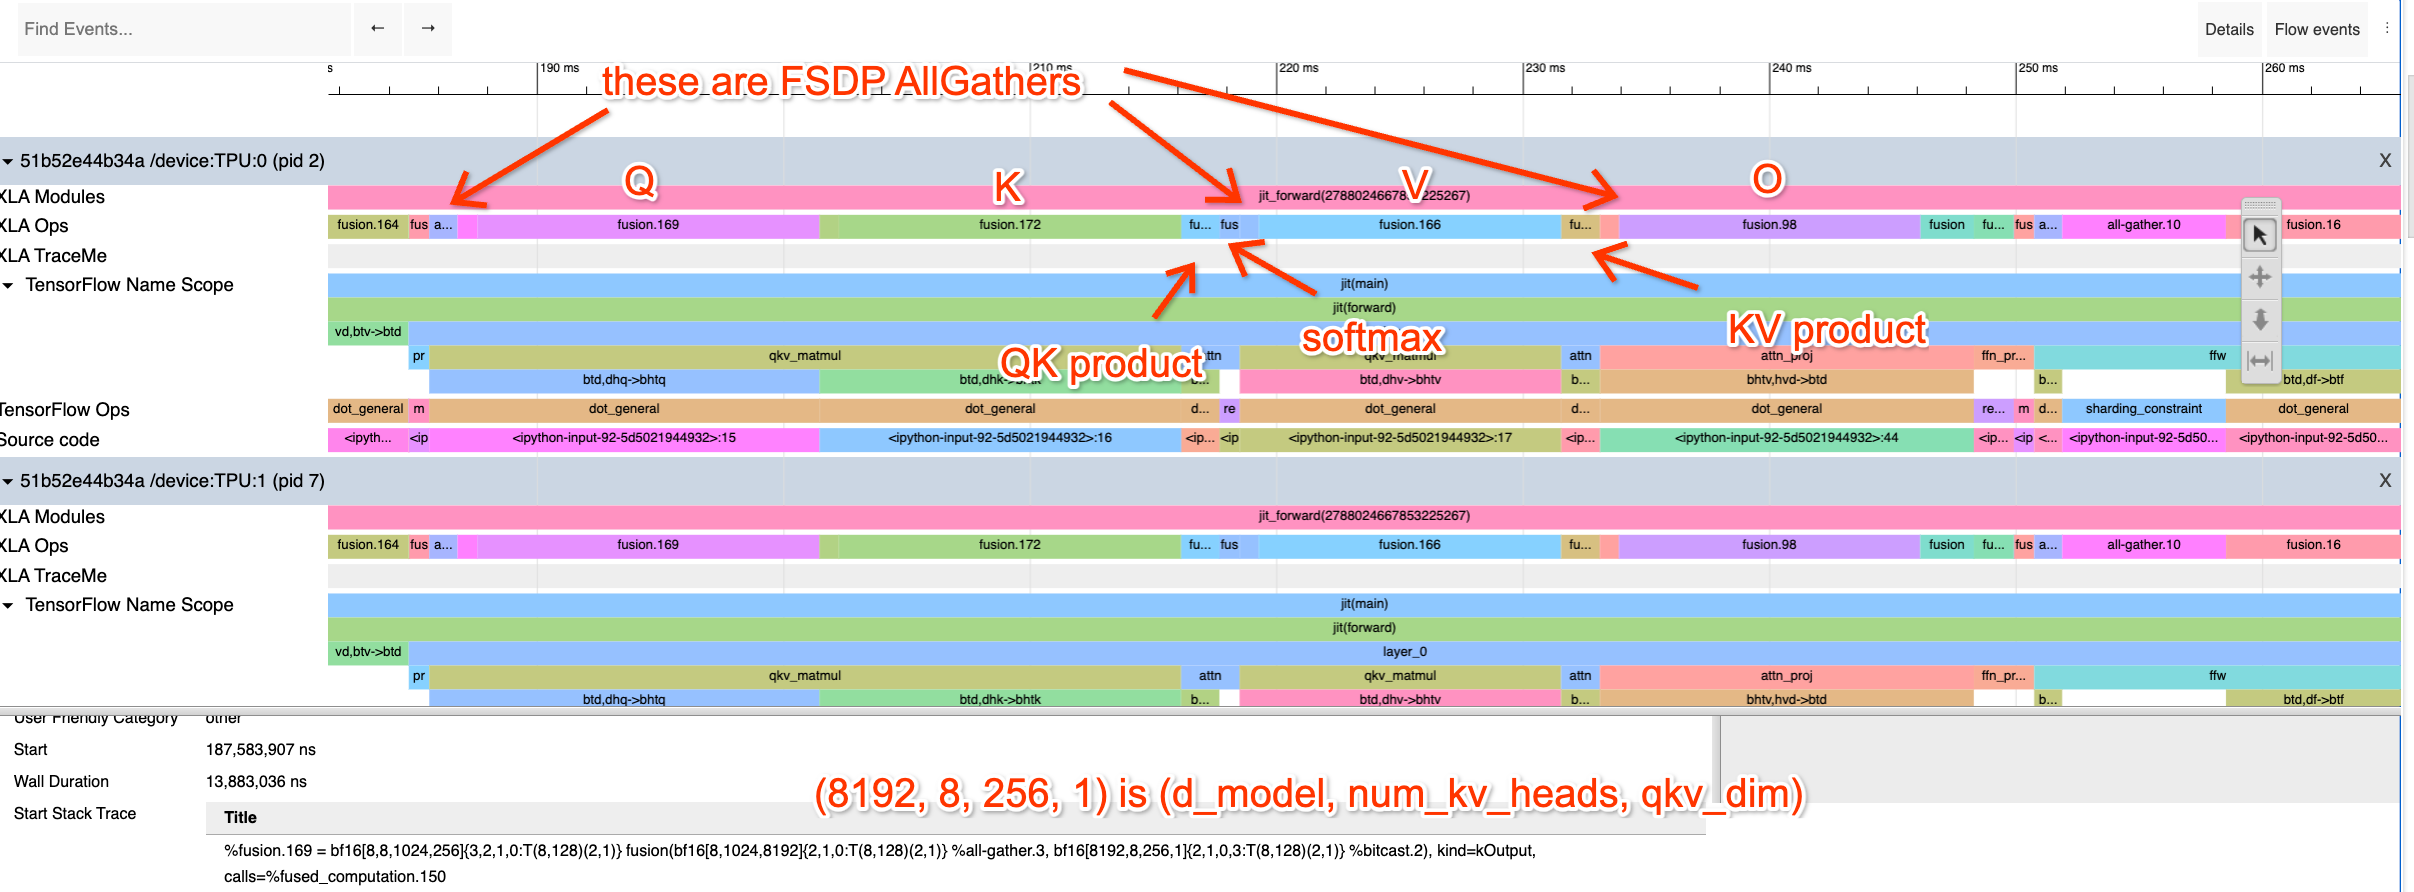
I’ve clicked on the Q projection op, which uses a matrix \(W_Q\) of shape [dmodel = 8192, nheads = 32, dqkv = 256]. We’re Megatron sharding along the head dimension. Try to do the same exercise of calculating how long these should take.
Memory Profile
The Memory Profile makes it easy to see the program memory as a function of time. This is helpful for debugging OOMs. You can see here about 7.5GB allocated to model parameters and about 10GB free. So we can fit a lot more into memory.

Worked Problems
Question 1: take a look at this Colab/profile and figure out what looks suspicious and what’s going on here. Can you tell me exactly what computations are happening and what each operation is doing? What are the true shapes of each matrix involved and how are they sharded? Try looking at the profile first without reading the code.
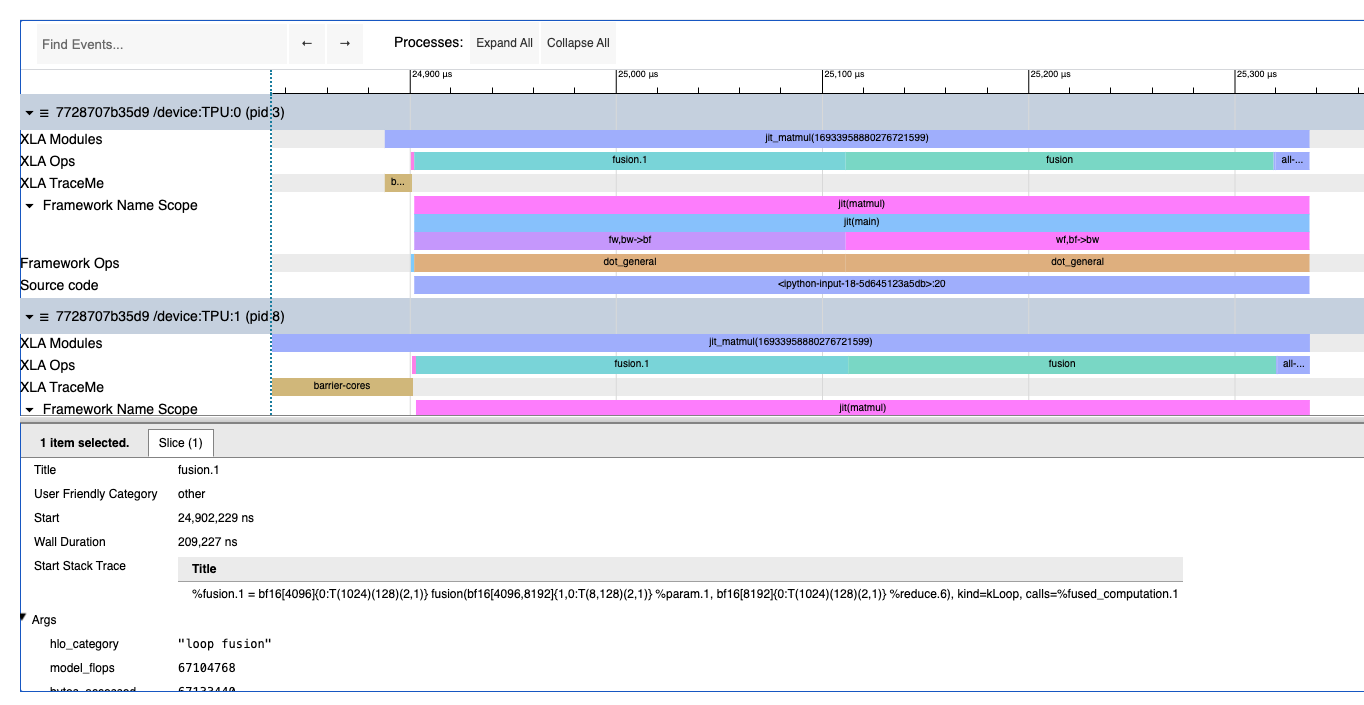
Click here for the answer.
This is two matrix multiplications, i.e. specifically this:
def matmul(w1, w2, x):
  return jnp.einsum('wf,bf->bw', w2, jnp.einsum('fw,bw->bf', w1, x))
You can see a reduce, two big fusions, and an all-reduce. The first big fusion is:
%fusion.1 = bf16[4096]{0:T(1024)(128)(2,1)} fusion(bf16[4096,8192]{1,0:T(8,128)(2,1)} %param.1, bf16[8192]{0:T(1024)(128)(2,1)} %reduce.6), kind=kLoop, calls=%fused_computation.1
which tells us the per-shard shape is bf16[8192] * bf16[4096, 8192] -> bf16[4096] (over the 8192 dimension). By observing the final AllReduce with replica_groups=\{\{0,16,32,48,64,80,96,112\}, ...\}, we can tell we’re doing 8-way model parallelism, so the true shapes are [8, 8192] * bf16[32768, 8192] -> bf16[8, 32768].
Question 2: The Transformer Colab from earlier implements a simple mock Transformer. Follow the instructions in the Colab and get a benchmark of the naive Transformer with GSPMD partitioning. How long does each part take? How long should it take? What sharding is being used? Try fixing the sharding! Hint: use jax.lax.with_sharding_constraint to constrain the behavior. With this fix, what’s the best MXU you can get?
For reference, the initial version gets roughly 184ms / layer and the optimized profile gets 67 ms / layer. Once you’ve done this, try staring at the profile and see if you can answer these questions purely from the profile:
- What sharding strategy is this?
- What is the batch size, \(d_\text{model}\), \(d_\text{ff}\)?
- What fraction of time is spent on attention vs. the MLP block?
- What fraction of time should be spent on each op at the roofline?
Note: since this problem was written, the XLA compiler has gotten better. The initial version is now at roughly 90ms / layer and the optimized profile is only about 10ms / layer better (80 ms / layer). Still, it’s worth playing with and seeing if you can do better.